LOADING

Enable the browser cache if loading is slow

Linux command: Top

Top command is used to show the Linux process. It provides a dynamic real-time view of the system status.

Usually, the command shows the summary information of the system and the running processes or threads.

Here, I will explain how to use the command and interpret the information.

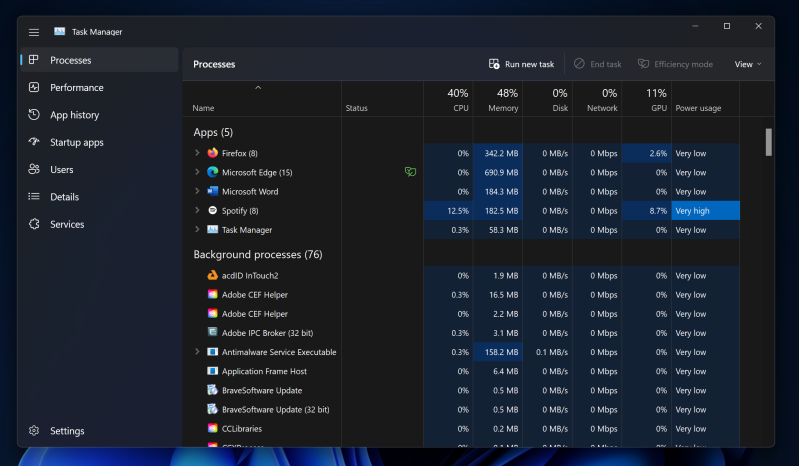
Explain the command with a picture in Windows:

1

It will open interactive command mode as soon as you run this command.

And press q to exit.
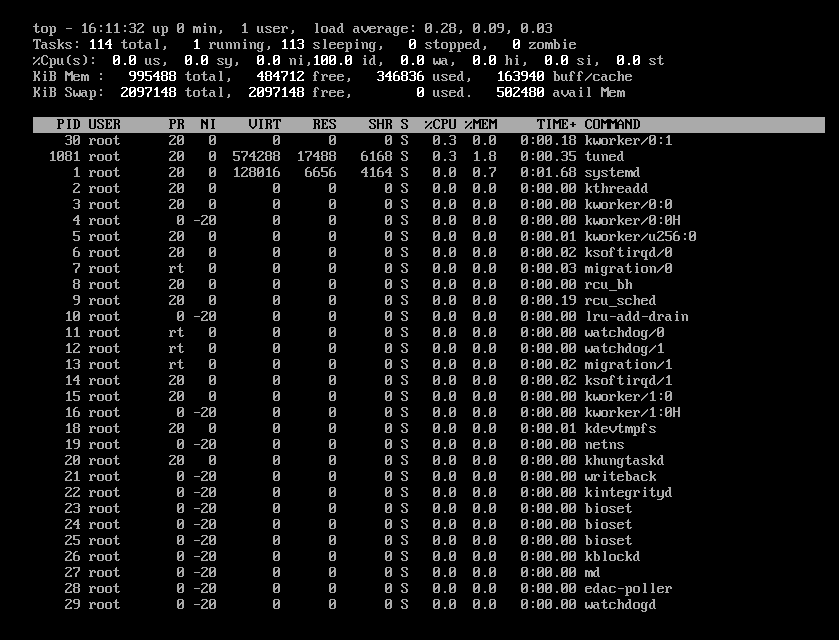
Here is an example:

top - 09:25:41 up 1 min,  3 users,  load average: 0.27, 0.11, 0.04
Tasks: 127 total,   1 running, 126 sleeping,   0 stopped,   0 zombie
%Cpu(s):  0.0 us,  0.0 sy,  0.0 ni,100.0 id,  0.0 wa,  0.0 hi,  0.0 si,  0.0 st
KiB Mem :   995488 total,   465908 free,   360852 used,   168728 buff/cache
KiB Swap:  2097148 total,  2097148 free,        0 used.   488308 avail Mem 

   PID USER      PR  NI    VIRT    RES    SHR S  %CPU %MEM     TIME+ COMMAND                                                                                                                                                                           
     1 root      20   0  193552   6664   4160 S   0.0  0.7   0:01.78 systemd                                                                                                                                                         
     2 root      20   0       0      0      0 S   0.0  0.0   0:00.00 kthreadd                                                                                                                                                                          
     3 root      20   0       0      0      0 S   0.0  0.0   0:00.00 kworker/0:0                                                                                                                                                                       
     4 root       0 -20       0      0      0 S   0.0  0.0   0:00.00 kworker/0:0H                                                                                                                                                                      
     5 root      20   0       0      0      0 S   0.0  0.0   0:00.02 kworker/u256:0                                                                                                                                                                    
     6 root      20   0       0      0      0 S   0.0  0.0   0:00.04 ksoftirqd/0                                                                                                                                                                       
     7 root      rt   0       0      0      0 S   0.0  0.0   0:00.04 migration/0                                                                                                                                                                       
     8 root      20   0       0      0      0 S   0.0  0.0   0:00.00 rcu_bh                                                                                                                                                                            
     9 root      20   0       0      0      0 S   0.0  0.0   0:00.17 rcu_sched                                                                                                                                                                         
    10 root       0 -20       0      0      0 S   0.0  0.0   0:00.00 lru-add-drain                                                                                                                                                                     
    11 root      rt   0       0      0      0 S   0.0  0.0   0:00.00 watchdog/0                                                                                                                                                                        
    12 root      rt   0       0      0      0 S   0.0  0.0   0:00.00 watchdog/1                                                                                                                                                                        
    13 root      rt   0       0      0      0 S   0.0  0.0   0:00.01 migration/1                                                                                                                                                                       
    14 root      20   0       0      0      0 S   0.0  0.0   0:00.01 ksoftirqd/1                                                                                                                                                                       
    15 root      20   0       0      0      0 S   0.0  0.0   0:00.00 kworker/1:0                                                                                                                                                                       
    16 root       0 -20       0      0      0 S   0.0  0.0   0:00.00 kworker/1:0H                                                                                                                                                                      
    18 root      20   0       0      0      0 S   0.0  0.0   0:00.01 kdevtmpfs                                                                                                                                                                         
    19 root       0 -20       0      0      0 S   0.0  0.0   0:00.00 netns                                                                                                                                                                             
    20 root      20   0       0      0      0 S   0.0  0.0   0:00.00 khungtaskd                                                                                                                                                                        
    21 root       0 -20       0      0      0 S   0.0  0.0   0:00.00 writeback                                                                                                                                                                         
    22 root       0 -20       0      0      0 S   0.0  0.0   0:00.00 kintegrityd                                                                                                                                                                       
    23 root       0 -20       0      0      0 S   0.0  0.0   0:00.00 bioset                                                                                                                                                                            
    24 root       0 -20       0      0      0 S   0.0  0.0   0:00.00 bioset                                                                                                                                                                            
    25 root       0 -20       0      0      0 S   0.0  0.0   0:00.00 bioset                                                                                                                                                                            
    26 root       0 -20       0      0      0 S   0.0  0.0   0:00.00 kblockd                                                                                                                                                                           
    27 root       0 -20       0      0      0 S   0.0  0.0   0:00.00 md  

The first five lines of the display are the system status and the other are the status monitoring of every process.

System status

top - 09:25:41 up 1 min,  3 users,  load average: 0.27, 0.11, 0.04
Tasks: 127 total,   1 running, 126 sleeping,   0 stopped,   0 zombie
%Cpu(s):  0.0 us,  0.0 sy,  0.0 ni,100.0 id,  0.0 wa,  0.0 hi,  0.0 si,  0.0 st
KiB Mem :   995488 total,   465908 free,   360852 used,   168728 buff/cache
KiB Swap:  2097148 total,  2097148 free,        0 used.   488308 avail Mem 

First line

top - 09:25:41 up 1 min,  3 users,  load average: 0.27, 0.11, 0.04

09:25:41 : The system time.

up 1 min : The system runs for less than a minute.

up 70 days, 16:44 : The system runs for 70 days,16 hours and 44 minutes.

3 users : 3 users has login in the system.

load average: 0.27, 0.11, 0.04 : Load condition of the system(1min, 5min, 15min).

If the load average value are bigger than 5, the system may be overloaded.

Second line

Tasks: 127 total,   1 running, 126 sleeping,   0 stopped,   0 zombie

Literally.

Third line

%Cpu(s):  0.0 us,  0.0 sy,  0.0 ni,100.0 id,  0.0 wa,  0.0 hi,  0.0 si,  0.0 st

0.0 us : Percent of CPU used by user space.

0.0 sy : Percent of CPU used by system space.

0.0ni : Percent of time spent running processes with manually configured Nice Value.

What’s is Nice Value?

100.0 id : Time idle (if high, CPU may be overworked).

My Time idle is high cuz I haven’t run any compute-Intensive tasks

0.0 wa : Wait time(if high, CPU is waiting for I/O access).

0.0 hi : Percent of time managing hardware interrupts.

0.0 si : Percent of time managing software interrupts.

0.0 st : Percent of virtual CPU time waiting for access to physical CPU.

The last two lines

KiB Mem :   995488 total,   465908 free,   360852 used,   168728 buff/cache
KiB Swap:  2097148 total,  2097148 free,        0 used.   488308 avail Mem

KiB Mem

995488 total : Consumed memory.

465908 free : Available memory.

360852 used : Consumed memory.

168728 buff/cache : The amount of information buffered to be written.

KiB Swap

2097148 total : Total swap memory.

2097148 free : Available swap space.

0 used : Consumed swap space.

We need to pay extra attention to the Used memory of Swap space.

If this value keeps changing, it proves that the kernel and swap space are constantly exchanging memory, which proves that the memory is not enough.

It should also be noted that the free memory in KiB Mem refers to the amount of memory managed by the kernel. It’s not the amount of remaining "Free" memory.

Tasks monitoring

   PID USER      PR  NI    VIRT    RES    SHR S  %CPU %MEM     TIME+ COMMAND                                                                                                                                                                           
     1 root      20   0  193552   6664   4160 S   0.0  0.7   0:01.78 systemd                                                                                                                                                         
     2 root      20   0       0      0      0 S   0.0  0.0   0:00.00 kthreadd                                                                                                                                                                          
     3 root      20   0       0      0      0 S   0.0  0.0   0:00.00 kworker/0:0                                                                                                                                    
     4 root       0 -20       0      0      0 S   0.0  0.0   0:00.00 kworker/0:0H
     
     ......

PID : Process id.

USER : Process user.

PR : Process priority.

NI : Nice Value.

VIRT : Virtual memory process used(KiB).

VIRT=SWAP+RES

RES : The physical memory size used by the process and not swapped out(KiB).

RES=CODE+DATA

SHR : Shared memory(KiB).

S : Process Status.

D : Indestructible sleeping.

R : Running.

S : Sleeping.

T : Stopped.

Z : Zombie.

%CPU : Percent of CPU used.

%MEM : Percent of Memory process used.

TIME+ : CPU time process used(unit 0.01second).

COMMAND : Process name.

Option

top -d 3

Set the update time to 3 seconds.

The default value is 5.

top -n 2

Set the number of information updates to 2 times.

top -S

Reverses the last remembered S state. When the cumulative time toggle is ON, each process is listed with the CPU time it has used.

Here for more information.